| Line 113: | Line 113: | ||
==Conversion table between the different temperature units== |
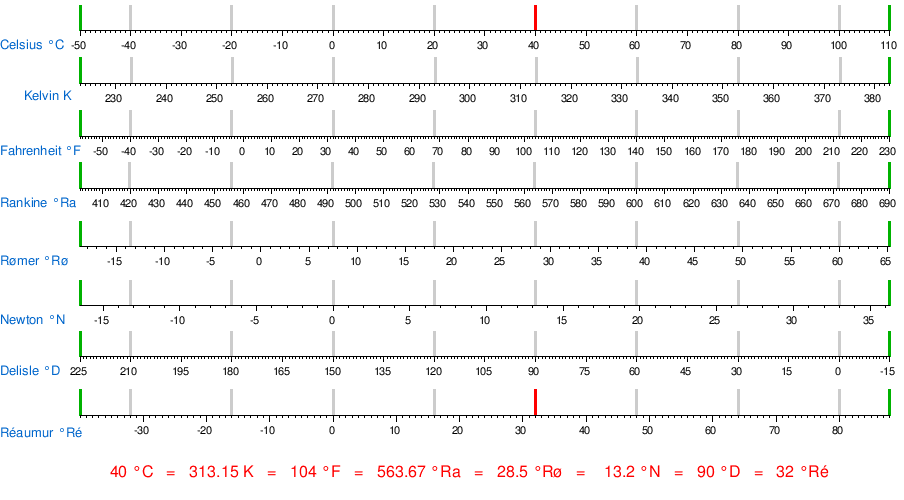
==Conversion table between the different temperature units== |
||
| − | <timeline>ImageSize = width:905 height:50 |
||
| − | PlotArea = left:80 right:15 bottom:20 top:5 |
||
| − | AlignBars = justify |
||
| − | Colors = |
||
| − | id:black value:black |
||
| − | id:white value:white |
||
| − | id:lightline value:rgb(0.8,0.8,0.8) |
||
| − | Period = from:-50 till:110 |
||
| − | TimeAxis = orientation:horizontal |
||
| − | ScaleMajor = unit:year increment:10 start:-50 |
||
| − | ScaleMinor = unit:year increment:1 start:-50 |
||
| − | |||
| − | PlotData= |
||
| − | align:center textcolor:black fontsize:8 mark:(line,black) width:5 shift:(0,-5) |
||
| − | LineData= |
||
| − | at:start color:green layer:front |
||
| − | at:end color:green layer:front |
||
| − | |||
| − | at:-40 color:lightline layer:back |
||
| − | at:-20 color:lightline layer:back |
||
| − | at:0 color:lightline layer:back |
||
| − | at:20 color:lightline layer:back |
||
| − | at:40 color:red layer:back |
||
| − | at:60 color:lightline layer:back |
||
| − | at:80 color:lightline layer:back |
||
| − | at:100 color:lightline layer:back |
||
| − | TextData = |
||
| − | fontsize:10 |
||
| − | textcolor:blue |
||
| − | pos:(0,13) |
||
| − | text:Celsius °C |
||
| − | </timeline><timeline> |
||
| − | ImageSize = width:905 height:50 |
||
| − | PlotArea = left:80 right:15 bottom:20 top:5 |
||
| − | AlignBars = justify |
||
| − | Colors = |
||
| − | id:black value:black |
||
| − | id:white value:white |
||
| − | id:lightline value:rgb(0.8,0.8,0.8) |
||
| − | Period = from:223 till:383 |
||
| − | TimeAxis = orientation:horizontal |
||
| − | ScaleMajor = unit:year increment:10 start:230 |
||
| − | ScaleMinor = unit:year increment:1 start:223 |
||
| − | PlotData= |
||
| − | align:center textcolor:black fontsize:8 mark:(line,black) width:25 shift:(0,-5) |
||
| − | LineData= |
||
| − | at:start color:green layer:front |
||
| − | at:end color:green layer:front |
||
| − | at:233.15 color:lightline layer:back |
||
| − | at:253.15 color:lightline layer:back |
||
| − | at:273.15 color:lightline layer:back |
||
| − | at:293.15 color:lightline layer:back |
||
| − | at:313.15 color:lightline layer:back |
||
| − | at:333.15 color:lightline layer:back |
||
| − | at:353.15 color:lightline layer:back |
||
| − | at:373.15 color:lightline layer:back |
||
| − | TextData = |
||
| − | fontsize:10 |
||
| − | textcolor:blue |
||
| − | pos:(25,15) |
||
| − | text:Kelvin K |
||
| − | </timeline><timeline> |
||
| − | ImageSize = width:905 height:50 |
||
| − | PlotArea = left:80 right:15 bottom:20 top:5 |
||
| − | AlignBars = justify |
||
| − | Colors = |
||
| − | id:black value:black |
||
| − | id:white value:white |
||
| − | id:lightline value:rgb(0.8,0.8,0.8) |
||
| − | Period = from:-58 till:230 |
||
| − | TimeAxis = orientation:horizontal |
||
| − | ScaleMajor = unit:year increment:10 start:-50 |
||
| − | ScaleMinor = unit:year increment:1 start:-58 |
||
| − | PlotData= |
||
| − | align:center textcolor:black fontsize:8 mark:(line,black) width:25 shift:(0,-5) |
||
| − | LineData= |
||
| − | at:start color:green layer:front |
||
| − | at:end color:green layer:front |
||
| − | at:-40 color:lightline layer:back |
||
| − | at:-4 color:lightline layer:back |
||
| − | at:32 color:lightline layer:back |
||
| − | at:68 color:lightline layer:back |
||
| − | at:104 color:lightline layer:back |
||
| − | at:140 color:lightline layer:back |
||
| − | at:176 color:lightline layer:back |
||
| − | at:212 color:lightline layer:back |
||
| − | TextData = |
||
| − | fontsize:10 |
||
| − | textcolor:blue |
||
| − | pos:(0,13) |
||
| − | text:Fahrenheit °F |
||
| − | </timeline><timeline> |
||
| − | ImageSize = width:905 height:50 |
||
| − | PlotArea = left:80 right:15 bottom:20 top:5 |
||
| − | AlignBars = justify |
||
| − | Colors = |
||
| − | id:black value:black |
||
| − | id:white value:white |
||
| − | id:lightline value:rgb(0.8,0.8,0.8) |
||
| − | Period = from:402 till:690 |
||
| − | TimeAxis = orientation:horizontal |
||
| − | ScaleMajor = unit:year increment:10 start:410 |
||
| − | ScaleMinor = unit:year increment:1 start:402 |
||
| − | PlotData= |
||
| − | align:center textcolor:black fontsize:8 mark:(line,black) width:25 shift:(0,-5) |
||
| − | LineData= |
||
| − | at:start color:green layer:front |
||
| − | at:end color:green layer:front |
||
| − | at:419.7 color:lightline layer:back |
||
| − | at:455.7 color:lightline layer:back |
||
| − | at:491.7 color:lightline layer:back |
||
| − | at:527.7 color:lightline layer:back |
||
| − | at:563.7 color:lightline layer:back |
||
| − | at:599.7 color:lightline layer:back |
||
| − | at:635.7 color:lightline layer:back |
||
| − | at:671.7 color:lightline layer:back |
||
| − | TextData = |
||
| − | fontsize:10 |
||
| − | textcolor:blue |
||
| − | pos:(0,13) |
||
| − | text:Rankine °Ra |
||
| − | </timeline><timeline>ImageSize = width:905 height:50 |
||
| − | PlotArea = left:80 right:15 bottom:20 top:5 |
||
| − | AlignBars = justify |
||
| − | Colors = |
||
| − | id:black value:black |
||
| − | id:white value:white |
||
| − | id:lightline value:rgb(0.8,0.8,0.8) |
||
| − | Period = from:-18.75 till:65.25 |
||
| − | TimeAxis = orientation:horizontal |
||
| − | ScaleMajor = unit:year increment:5 start:-15 |
||
| − | ScaleMinor = unit:year increment:1 start:-18 |
||
| − | |||
| − | PlotData= |
||
| − | align:center textcolor:black fontsize:8 mark:(line,black) width:5 shift:(0,-5) |
||
| − | LineData= |
||
| − | at:start color:green layer:front |
||
| − | at:end color:green layer:front |
||
| − | |||
| − | at:-13.5 color:lightline layer:back |
||
| − | at:-3 color:lightline layer:back |
||
| − | at:7.5 color:lightline layer:back |
||
| − | at:18 color:lightline layer:back |
||
| − | at:28.5 color:lightline layer:back |
||
| − | at:39 color:lightline layer:back |
||
| − | at:49.5 color:lightline layer:back |
||
| − | at:60 color:lightline layer:back |
||
| − | TextData = |
||
| − | fontsize:10 |
||
| − | textcolor:blue |
||
| − | pos:(0,13) |
||
| − | text:Rømer °Rø |
||
| − | </timeline><timeline>ImageSize = width:905 height:50 |
||
| − | PlotArea = left:80 right:15 bottom:20 top:5 |
||
| − | AlignBars = justify |
||
| − | Colors = |
||
| − | id:black value:black |
||
| − | id:white value:white |
||
| − | id:lightline value:rgb(0.8,0.8,0.8) |
||
| − | Period = from:-16.5 till:36.3 |
||
| − | TimeAxis = orientation:horizontal |
||
| − | ScaleMajor = unit:year increment:5 start:-15 |
||
| − | ScaleMinor = unit:year increment:1 start:-15 |
||
| − | |||
| − | PlotData= |
||
| − | align:center textcolor:black fontsize:8 mark:(line,black) width:5 shift:(0,-5) |
||
| − | LineData= |
||
| − | at:start color:green layer:front |
||
| − | at:end color:green layer:front |
||
| − | |||
| − | at:-13.2 color:lightline layer:back |
||
| − | at:-6.6 color:lightline layer:back |
||
| − | at:0 color:lightline layer:back |
||
| − | at:6.6 color:lightline layer:back |
||
| − | at:13.2 color:lightline layer:back |
||
| − | at:19.8 color:lightline layer:back |
||
| − | at:26.4 color:lightline layer:back |
||
| − | at:33 color:lightline layer:back |
||
| − | TextData = |
||
| − | fontsize:10 |
||
| − | textcolor:blue |
||
| − | pos:(0,13) |
||
| − | text:Newton °N |
||
| − | </timeline><timeline>ImageSize = width:905 height:50 |
||
| − | PlotArea = left:80 right:15 bottom:20 top:5 |
||
| − | AlignBars = justify |
||
| − | Colors = |
||
| − | id:black value:black |
||
| − | id:white value:white |
||
| − | id:lightline value:rgb(0.8,0.8,0.8) |
||
| − | Period = from:-15 till:225 |
||
| − | DateFormat = yyyy |
||
| − | TimeAxis = orientation:horizontal order:reverse format:yyyy |
||
| − | ScaleMajor = unit:year increment:15 start:-15 |
||
| − | ScaleMinor = unit:year increment:1 start:-15 |
||
| − | |||
| − | |||
| − | LineData= |
||
| − | at:start color:green layer:front |
||
| − | at:end color:green layer:front |
||
| − | |||
| − | at:0 color:lightline layer:back |
||
| − | at:30 color:lightline layer:back |
||
| − | at:60 color:lightline layer:back |
||
| − | at:90 color:lightline layer:back |
||
| − | at:120 color:lightline layer:back |
||
| − | at:150 color:lightline layer:back |
||
| − | at:180 color:lightline layer:back |
||
| − | at:210 color:lightline layer:back |
||
| − | TextData = |
||
| − | fontsize:10 |
||
| − | textcolor:blue |
||
| − | pos:(0,13) |
||
| − | text:Delisle °D |
||
| − | </timeline><timeline> |
||
| − | ImageSize = width:905 height:100 |
||
| − | PlotArea = left:80 right:15 bottom:70 top:5 |
||
| − | AlignBars = justify |
||
| − | Colors = |
||
| − | id:black value:black |
||
| − | id:white value:white |
||
| − | id:lightline value:rgb(0.8,0.8,0.8) |
||
| − | Period = from:-40 till:88 |
||
| − | TimeAxis = orientation:horizontal |
||
| − | ScaleMajor = unit:year increment:10 start:-30 |
||
| − | ScaleMinor = unit:year increment:1 start:-40 |
||
| − | PlotData= |
||
| − | align:center textcolor:black fontsize:8 mark:(line,black) width:25 shift:(0,-5) |
||
| − | LineData= |
||
| − | at:start color:green layer:front |
||
| − | at:end color:green layer:front |
||
| − | at:-32 color:lightline layer:back |
||
| − | at:-16 color:lightline layer:back |
||
| − | at:0 color:lightline layer:back |
||
| − | at:16 color:lightline layer:back |
||
| − | at:32 color:red layer:back |
||
| − | at:48 color:lightline layer:back |
||
| − | at:64 color:lightline layer:back |
||
| − | at:80 color:lightline layer:back |
||
| − | TextData = |
||
| − | fontsize:10 |
||
| − | textcolor:blue |
||
| − | pos:(0,60) |
||
| − | text:Réaumur °Ré |
||
| − | fontsize:12 |
||
| − | textcolor:red |
||
| − | pos:(110,20) |
||
| − | text:40 °C = 313.15 K = 104 °F = 563.67 °Ra = 28.5 °Rø = 13.2 °N = 90 °D = 32 °Ré |
||
| − | </timeline> |
||
[[File:Scales.png]] |
[[File:Scales.png]] |
||
Revision as of 10:48, 12 March 2012
The following table gives a comparison of the numerical value of temperatures on a number of different scales:
| Kelvin | Celsius | Fahrenheit | Rankine | Delisle | Newton | Réaumur | Rømer | |
|---|---|---|---|---|---|---|---|---|
| Absolute zero | 0 | −273.15 | −459.67 | 0 | 559.725 | −90.14 | −218.52 | −135.90 |
| Fahrenheit's ice/salt mixture | 255.37 | −17.78 | 0 | 459.67 | 176.67 | −5.87 | −14.22 | −1.83 |
| Water freezes (at standard pressure) | 273.15 | 0 | 32 | 491.67 | 150 | 0 | 0 | 7.5 |
| Average human body temperature (See note below) |
310.0 | 36.8 | 98.2 | 557.9 | 94.5 | 12.21 | 29.6 | 26.925 |
| Water boils (at standard pressure) | 373.15 | 100 | 212 | 671.67 | 0 | 33 | 80 | 60 |
| Titanium melts | 1941 | 1668 | 3034 | 3494 | −2352 | 550 | 1334 | 883 |
| The surface of the Sun | 5800 | 5526 | 9980 | 10440 | −8140 | 1823 | 4421 | 2909 |
Note: Normal human body temperature is 36.8 °C ±0.7 °C, or 98.2 °F ±1.3 °F. The commonly given value 98.6 °F is simply the exact conversion of 37 °C, and therefore has excess (invalid) precision. Some numbers in this table have been rounded off.
Formulas for conversion
Given any two fixed points, the formula for conversion between any two scales in the table above can be determined. If two rows and two columns appar as:
| Scale X | Scale Y | |
|---|---|---|
| Fixed point 1 | a | b |
| Fixed point 2 | c | d |
the formula can be derived:

where

and
- .

Conversion table between the different temperature units